
Supporting airline ticket purchase: Buy now or wait?
Date of analysis: May 28, 2008
Table of Contents
- Problem statement
- Data collection and processing
2.1. Data collection
2.2. Missing value processing
2.3. Dependent variables and Independent variables
2.4. Data reduction: factor analysis
2.5. Final data - Analysis
3.1 Scatter plot diagram
3.2 Decision Tree - Summary
Problem statement
Airplane ticket prices fluctuate according to various conditions, and airlines do not disclose pricing policies, so it is difficult to forecast prices. Therefore, even if you board the same plane, the amount of money you pay for a seat varies greatly. Smart buyers want to pay the least amount of money to buy a plane ticket, but it is very difficult to decide when to buy a plane ticket.
Online travel companies, such as Priceline, offer low fare alert services to help customers purchase airline tickets. When customers are interested in flights, they will be notified by email if the price have reached the one specified in advance. However, since these services are based on what has already happened, there is a disadvantage that if the prices continue to rise, they may miss the right time to buy an appropriate ticket.
To help customers buy airline tickets, I analyzed the data affecting a ticket price and used data mining techniques to find patterns. Based on the prediction that the airplane ticket will rise or fall tomorrow, I can assist customers to make the decision whether it is good to buy an airplane ticket now (Buy) or better to wait (Wait).
Data collection and processing
Data collection
The data related to airplane ticket fares were directly collected from KAYAK and Priceline. These data are collected from March 1, 2008 to May 28, 2008. The fare of airplane is so fluctuating that the fare is updated about 4 ~ 7 times a day, so the lowest fare among these prices is used. A summary of the data collected in relation to the airfare is as follows.
| Item | Description |
|---|---|
| Search dates | March 1, 2008 ~ May 28, 2008 (90 days) |
| Collection Term | 1 day |
| Airline | Multiple airlines (Non-stop and stopover using different airlines) |
| Route | LAX (Los Angeles) to HNL (Honolulu) |
| Grade | Economy |
| Trip way | Round trip |
Data on airplane fares and the factors affecting ticket prices (e.g., season, week, time, and the number of stops) are collected. I also collected external factors (e.g., oil prices) that can affect ticket prices.
Dependent variables and Independent variables
The following variables were collected for a total of 253 instances.
Dependent Variables (DVs)
buy (b) or wait (w)- Buy: Today price < Next day price, Wait: Today price >= Next day price
ticket_price- Lowest price on the search date
Independent Variables (IVs)
| Attribute | Type | Description |
|---|---|---|
remain_days | Numeric | Days remaining until travel date from the search date |
travel_duration | Numeric | Days of travel |
oil_price | Numeric | iPath S&P GSCI Crude Oil Tot Ret Idx ETN (OILNF) |
yesterday_ticket_price | Numeric | The lowest airfare of the day before the search date |
yesterday_oil_price | Numeric | Oil price the day before the search date |
trip_leave_date | Ordinal | - highly_busy (0): Summer vacation season (3rd week of July ~ 3rd week of August), New year’s day, Christmas season (4th week of December) - busy (1): Easter, Memorial day, Independence day, Labor day, Thanksgiving day - moderate (2): 2nd week of April ~ 2nd week of July, 2nd week of October ~ 2nd week of December - not_busy (3): other dates |
trip_leave_week | Ordinal | - most_busy (0): Saturday - busy (1): Friday - moderate (2): Sunday - not_busy (3): other weeks |
trip_leave_time | Nominal | - pre_am: 12 am ~ 6 am - early_am: 6 am ~ 9 am - morning: 9 am ~ 12pm - afternoon: 12 pm ~ 5 pm - evening: 5 pm ~ 9 pm - night: 9 pm ~ 12 am |
stop | Numeric | Number of stopovers to destination |
quarter | Ordinal | - end_quarter (0): 3rd to 4th weeks of March, June, September, December - not_end_quarter (1): other dates |
Missing value processing
In addition, the price of an airplane ticket is influenced by oil price. The oil prices from March 1, 2008 to May 28, 2008 were obtained from the iPath S&P GSCI Crude Oil Tot Ret Idx ETN (OILNF) in the finance section in the US Yahoo site. Oil prices are not traded on weekends and holidays, there are missing values. To handle this, the data for these days was filled at the prices traded the day before. That is, May 25, 2008 is the Memorial Day in the US, so there is no oil price data even though it is Monday, so it is filled with the transaction price on May 23, 2008.
Data reduction: factor analysis
Factor analysis was performed to reduce the variables and three variables of stop, trip_leave_time, and quarter were removed. First, the stop variable is eliminated because the the number of stops does not affect the price significantly since the collected data includes not only direct flights but also the multiple airline within a one airline. For the trip_leave_time was collected for the assumption that crowded use of daytime airplanes so the airfare is expected to be more expensive at day time than the one in the night; however, it was removed because it did not have a significant correlation with the price. The quarter was collected with the expectation that the company would put the airplane ticket at the end of the quarter at a cheap price to increase the total revenue; but it was removed because it did not show any correlation.
We did not perform the selection using the principal component analysis, because many variables are not taken into consideration, and the remaining variables are considered to be meaningful.
Final data
Analysis
Scatter plot diagram
The price of airplane tends to increase as the travel date approaches.
When the number of days remaining until the date of travel is the same, Thursday and Sunday start at a lower price, while Friday and Saturday start at a higher price.
To investigate the factors affecting the airplane ticket prices, I plotted scatter plot diagrams with IVs on the X axis and DV on the Y axis.
Scatter plot diagram sorted by trip_leave_week (X-axis: remain_days, Y-axis: ticket_price) 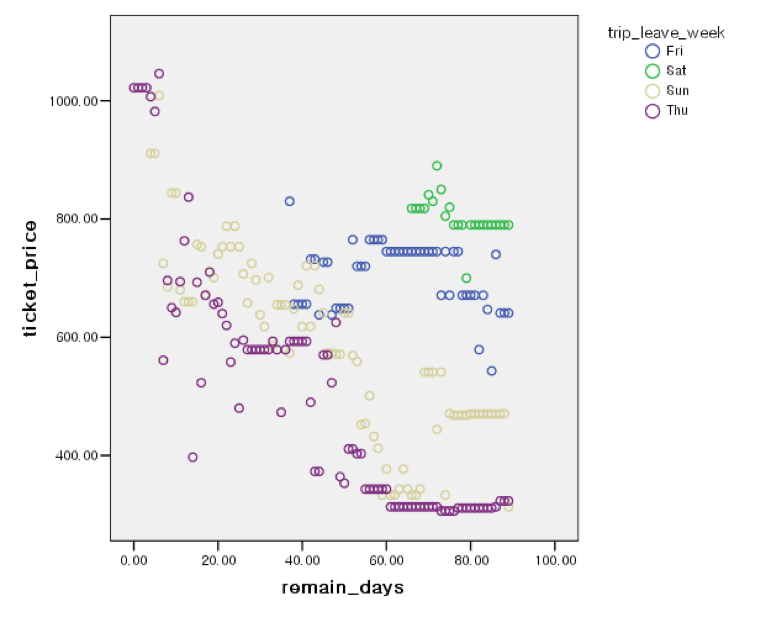
What is noteworthy is that, even if the number of days remaining until the date of travel (remain_days) is the same, the price is different according to the day of departure (trip_leave_week). For example, while 80 days remain equally, Thursday (purple) and Sunday (yellow) start at a lower price, while Friday (blue) and Saturday (green) start at a higher price.
Scatter plot diagram sorted by trip_leave_date (X-axis: remain_days, Y-axis: ticket_price) 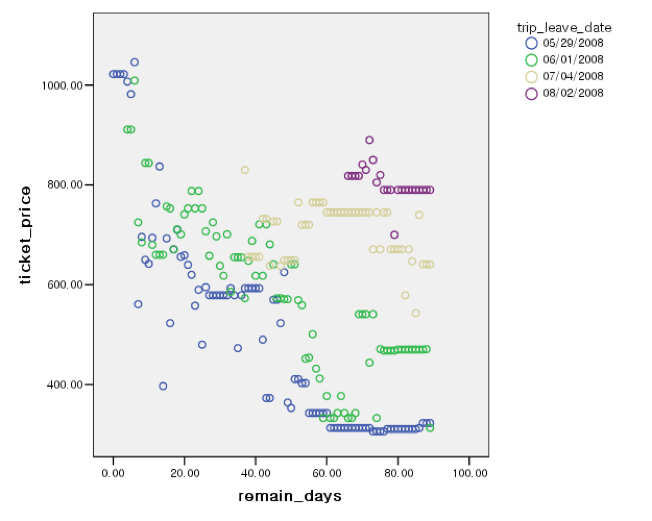
Likewise, even if the number of days remaining until the date of travel (remain_days) is the same, the price is different according to the date of departure (trip_leave_date). For example, while 80 days remain equally, 05/29/2008 (blue) and 06/01/2008 (green) start at a lower price, while 07/04/2008 (yellow) and 08/02/2008 (purple) start at a higher price. These differences are due to peak season and non-peak season. July 4 is the Independence Day of the United States and August 2 is the peak season for the summer vacation season.
Decision Tree
K-means clustering
We use K-means clustering to distinguish the data set and find the characteristics for each cluster. The size of K starts from 2 and clustering is repeated until the lift value is no longer increased. As a result of performing the cluster from K = 2 to K = 8, it stopped at K = 8 because the lift value is no longer improved.
- Metrics
Predicted yes | Predicted no | |
|---|---|---|
| True | a | b |
| False | c | d |
- precision = a/(a+c)
- recall = a/(a+b)
- lift = a/(a+c) / (a+b)/(a+b+c+d)
- Data set
| raw data | instances # | instances # | instances # | lift | lift | precision | precision | recall | recall |
|---|---|---|---|---|---|---|---|---|---|
buy | wait | total | buy | wait | buy | wait | buy | wait | |
| 78 | 175 | 253 | 1 | 1 | 0.3 | 0.69 | 1 | 1 |
- cluster K = 2
| cluster # | instances # | instances # | instances # | lift | lift | precision | precision | recall | recall |
|---|---|---|---|---|---|---|---|---|---|
buy | wait | total | buy | wait | buy | wait | buy | wait | |
| 1 | 56 | 109 | 165 | 1.1 | 0.95 | 0.33 | 0.66 | 0.71 | 0.62 |
| 2 | 22 | 66 | 88 | 0.81 | 1.08 | 0.25 | 0.75 | 0.28 | 0.37 |
- cluster K = 3
| cluster # | instances # | instances # | instances # | lift | lift | precision | precision | recall | recall |
|---|---|---|---|---|---|---|---|---|---|
buy | wait | total | buy | wait | buy | wait | buy | wait | |
| 1 | 21 | 55 | 76 | 0.9 | 1.05 | 0.27 | 0.72 | 0.26 | 0.31 |
| 2 | 20 | 61 | 81 | 0.8 | 1.09 | 0.25 | 0.75 | 0.26 | 0.35 |
| 3 | 37 | 59 | 96 | 1.25 | 0.88 | 0.38 | 0.65 | 0.48 | 0.34 |
- cluster K = 4
| cluster # | instances # | instances # | instances # | lift | lift | precision | precision | recall | recall |
|---|---|---|---|---|---|---|---|---|---|
buy | wait | total | buy | wait | buy | wait | buy | wait | |
| 1 | 39 | 82 | 121 | 1.05 | 0.98 | 0.32 | 0.677686 | 0.5 | 0.4685 |
| 2 | 15 | 45 | 60 | 0.81 | 1.08 | 0.25 | 0.75 | 0.1923 | 0.2571 |
| 3 | 19 | 44 | 63 | 0.97 | 1 | 0.3 | 0.698413 | 0.24359 | 0.2514 |
| 4 | 5 | 4 | 9 | 1.8 | 0.6 | 0.55 | 0.444444 | 0.0641 | 0.0228 |
- cluster K = 5
| cluster # | instances # | instances # | instances # | lift | lift | precision | precision | recall | recall |
|---|---|---|---|---|---|---|---|---|---|
buy | wait | total | buy | wait | buy | wait | buy | wait | |
| 1 | 15 | 45 | 60 | 0.81 | 1.08 | 0.25 | 0.75 | 0.1923 | 0.2571 |
| 2 | 16 | 42 | 58 | 0.89 | 1.05 | 0.27 | 0.724138 | 0.2051 | 0.24 |
| 3 | 30 | 36 | 66 | 1.47 | 0.78 | 0.45 | 0.545455 | 0.3846 | 0.2057 |
| 4 | 13 | 48 | 61 | 0.69 | 1.14 | 0.21 | 0.786885 | 0.1666 | 0.2742 |
| 5 | 4 | 4 | 8 | 1.62 | 0.72 | 0.5 | 0.5 | 0.0512 | 0.0228 |
- cluster K = 6
| cluster # | instances # | instances # | instances # | lift | lift | precision | precision | recall | recall |
|---|---|---|---|---|---|---|---|---|---|
buy | wait | total | buy | wait | buy | wait | buy | wait | |
| 1 | 21 | 42 | 63 | 1.08 | 0.96 | 0.33 | 0.666667 | 0.2692 | 0.24 |
| 2 | 8 | 22 | 30 | 0.86 | 1.06 | 0.26 | 0.733333 | 0.1025 | 0.1257 |
| 3 | 4 | 4 | 8 | 1.62 | 0.72 | 0.5 | 0.5 | 0.0512 | 0.0228 |
| 4 | 7 | 21 | 28 | 0.81 | 1.08 | 0.25 | 0.75 | 0.0897 | 0.12 |
| 5 | 26 | 45 | 71 | 1.18 | 0.91 | 0.36 | 0.633803 | 0.3333 | 0.2571 |
| 6 | 12 | 41 | 53 | 0.7 | 1.12 | 0.22 | 0.773585 | 0.1538 | 0.2342 |
- cluster K = 7
| cluster # | instances # | instances # | instances # | lift | lift | precision | precision | recall | recall |
|---|---|---|---|---|---|---|---|---|---|
buy | wait | total | buy | wait | buy | wait | buy | wait | |
| 1 | 13 | 43 | 56 | 0.75 | 1.11 | 0.23 | 0.767857 | 0.1666 | 0.2457 |
| 2 | 8 | 20 | 28 | 0.92 | 1.03 | 0.28 | 0.714286 | 0.1025 | 0.1142 |
| 3 | 5 | 8 | 13 | 1.24 | 0.88 | 0.38 | 0.615385 | 0.0641 | 0.0457 |
| 4 | 12 | 41 | 53 | 0.73 | 1.12 | 0.22 | 0.773585 | 0.1538 | 0.2342 |
| 5 | 3 | 4 | 7 | 1.42 | 0.82 | 0.42 | 0.571429 | 0.038 | 0.0227 |
| 6 | 11 | 26 | 37 | 0.96 | 1.01 | 0.29 | 0.702703 | 0.141 | 0.1485 |
| 7 | 26 | 33 | 59 | 1.46 | 0.81 | 0.44 | 0.559322 | 0.3333 | 0.188 |
- cluster K = 8
| cluster # | instances # | instances # | instances # | lift | lift | precision | precision | recall | recall |
|---|---|---|---|---|---|---|---|---|---|
buy | wait | total | buy | wait | buy | wait | buy | wait | |
| 1 | 8 | 31 | 39 | 0.68 | 1.15 | 0.2 | 0.794872 | 0.1025 | 0.1771 |
| 2 | 13 | 18 | 31 | 1.4 | 0.84 | 0.41 | 0.580645 | 0.1666 | 0.1028 |
| 3 | 21 | 34 | 55 | 1.3 | 0.89 | 0.38 | 0.618182 | 0.2692 | 0.1942 |
| 4 | 4 | 8 | 12 | 1.11 | 0.96 | 0.33 | 0.666667 | 0.0512 | 0.045 |
| 5 | 9 | 39 | 48 | 0.63 | 1.17 | 0.18 | 0.8125 | 0.1153 | 0.222 |
| 6 | 8 | 7 | 15 | 1.78 | 0.67 | 0.53 | 0.466667 | 0.102 | 0.04 |
| 7 | 3 | 4 | 7 | 1.42 | 0.82 | 0.42 | 0.571429 | 0.0384 | 0.022 |
| 8 | 12 | 34 | 46 | 0.87 | 1.07 | 0.26 | 0.73913 | 0.1538 | 0.1942 |
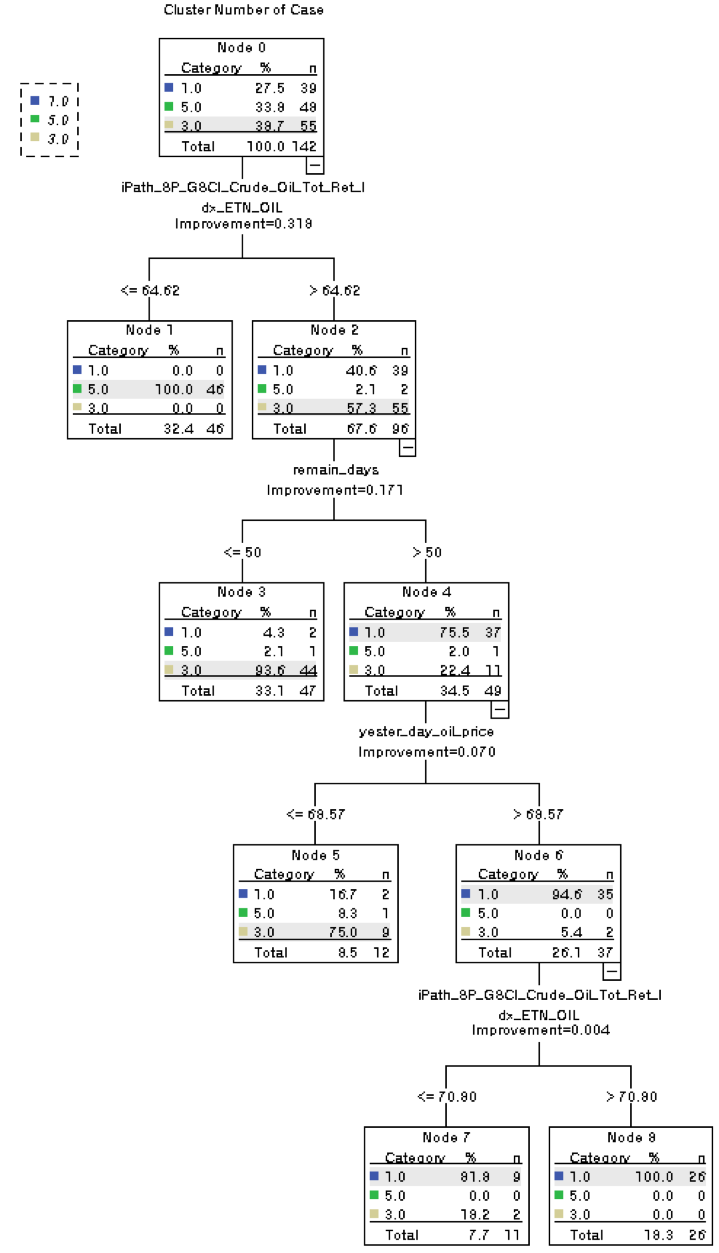
CRT (Classification and Regression Tree)
The decision tree shows that the major factors affecting airline ticket prices are
oil_priceandremain_days.
From this model, we can determine you may buy the ticket today ifoil_price > 64.62per barrel,remain_days > 50, andyesterday_oil_price < 69.57.
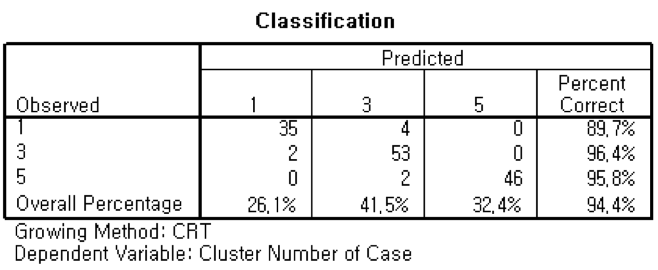
CRT tree based on the clusters of K = 1, 3, 5
Model summary
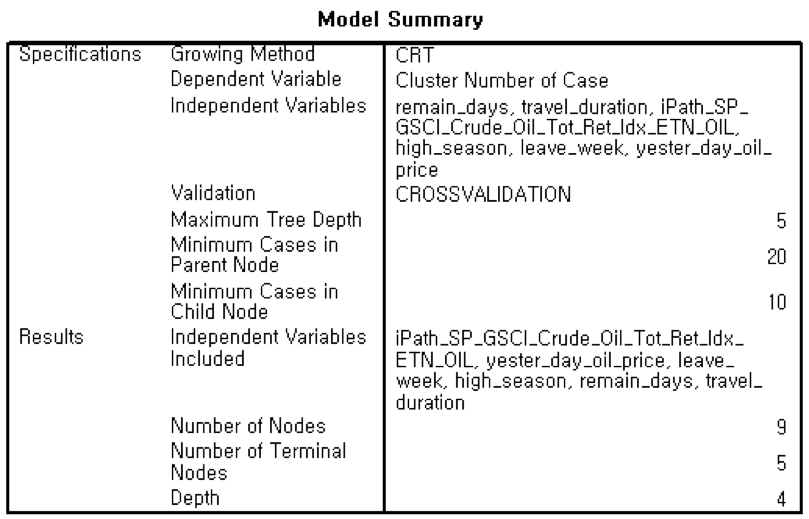
Validation (10-Fold Cross Validation)
Summary
From the result, I notice that the price of airplane tends to increase as the travel date approaches. When the number of days remaining until the date of travel is the same, Thursday and Sunday start at a lower price, while Friday and Saturday start at a higher price.
The prediction result that the tomorrow airplane price will rise or fall compared to the today price can be useful to customers who want to purchase airplane tickets. As mentioned above, it is difficult to predict the timing of the purchase of the optimal airline ticket because the airline pricing is very complicated due to many factors. Much more of data for longer period needs to be collected for building a more accurate prediction model.