
Model for Asia Countries using Global Competitiveness Index (GCI) Data
Date of analysis: April 1, 2008
Table of Contents
- Problem statement
- Data processing
2.1. Data sets
2.2. Dependent variables and Independent variables - Analysis
3.1 Scatter plot diagram
3.2 Boxplot: Data distribution
3.3 Decision Tree - Summary
Problem statement
The World Economic Forum annually publishes the Global Competitiveness Index (GCI) data from around the world. We obtained the GCI data from 43 countries for a total of six years from 2002 to 2007. When considering countries with high ranked countries are advanced countries, I can find valuable insights of the advanced countries. This can be used as a model to suggest a direction for developing countries to become advanced countries. In this analysis, I focus on Asia countries.
Data processing
Data sets
GCI_data_with_ranking.xlsx
year2002_dataset.xlsx
year2003_dataset.xlsx
year2004_dataset.xlsx
year2005_dataset.xlsx
year2006_dataset.xlsx
year2007_dataset.xlsx
Dependent variables and Independent variables
I excluded China, Mongolia, and Luxembourg, because they contained some of missing values. Therefore, there are a total of 40 countries in the data each year. The names of 13 Asia countries are listed as follows: Bangladesh, India, Indonesia, Japan, Korea (South), Malaysia, Taiwan, Thailand, Vietnam, Singapore, Philippines, Sri Lanka, and Hong Kong.
The following variables were collected for a total of 78 instances (13 countries x 6 years). The GCI values should be normalized in order to cross-compare data by year. Therefore, each GCI value is normalized such that the average value of the overall score of each year is 10.
Dependent Variables (DVs)
overall_score- absolute value and normalized
ranking- relative value (1 ~ 40)
Independent Variables (IVs)
Each country instance has 11 structured attributes. The three attributes of the Basic Requirement (BR), the Efficiency Enhancer (EE), and the Innovation and Sophistication Factors (IF) are the higher level attributes and the remaining attributes are the lower level attributes.
| Level 1 | Level 2 |
|---|---|
Basic Requirement (BR) | Institutions Infrastructure Macroeconomic Stability |
Efficiency Enhancers (EE) | Higher Education and Training Market Efficiency Technical Readiness |
Innovation and Sophistication Factors (IF) | Business Sophistication Innovation |
Analysis
Scatter plot diagram
All three independent variables,
BR,EE, andIF, affect the dependent variables of theoverall scoreand theranking.
For 13 Asian countries, I plotted six scatter plot diagrams with overall score and ranking on Y-axis and BR, EE, and IF on X-axis.
Scatter plot diagrams for Asia countries on overall_score
Each diagram showed an ellipse shape in which the value the overall score is increased (Y-axis) when BR, EE, and IF is increased (X-axis).
(X-axis:
Basic Requirements (BR), Y-axis:overall_score)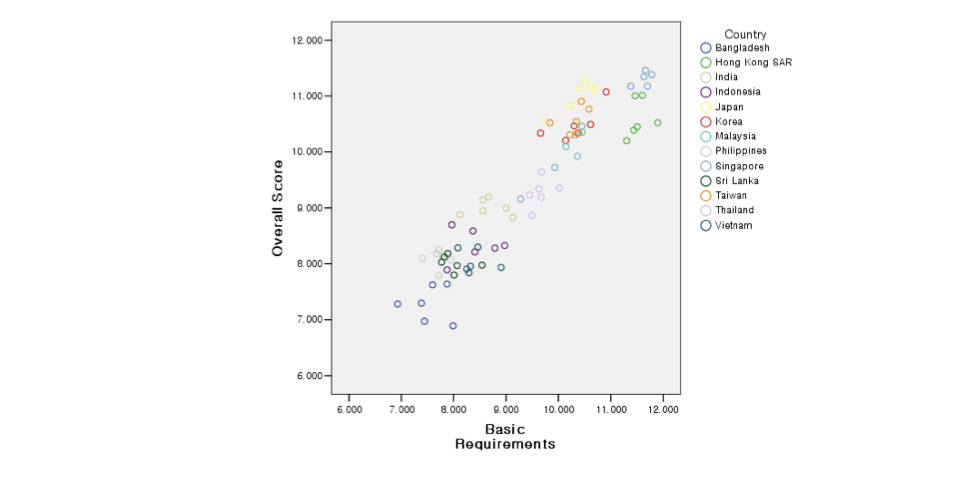
(X-axis:
Efficiency Enhancers (EE), Y-axis:overall_score)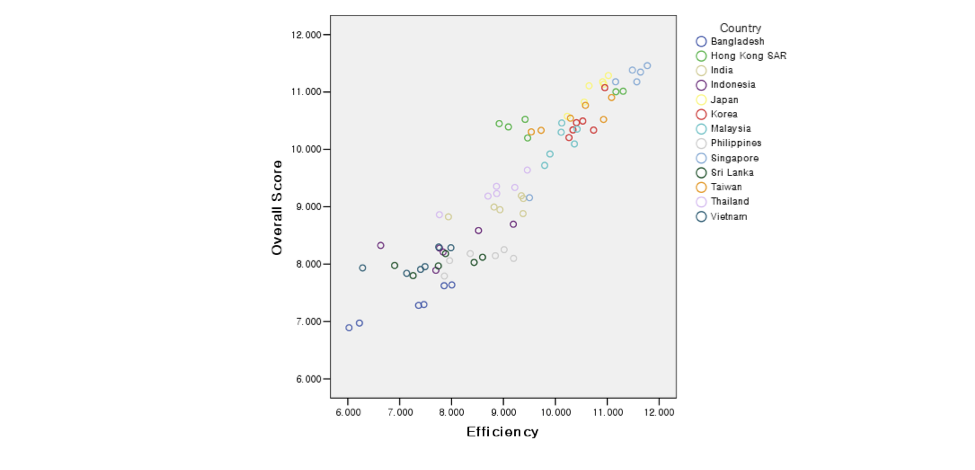
(X-axis:
Innovation and Sophistication Factors (IF), Y-axis:overall_score)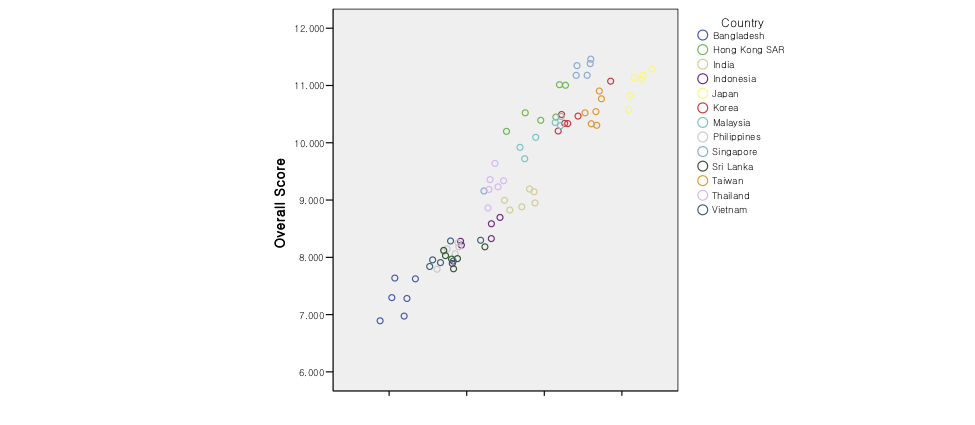
Scatter plot diagrams for Asia countries on ranking
Each diagram showed an ellipse shape in which the value the ranking is decreased (Y-axis) when BR, EE, and IF is increased (X-axis). Please note that in the case of ranking, the smaller the number represent the more advanced countries.
(X-axis:
Basic Requirements (BR), Y-axis:ranking)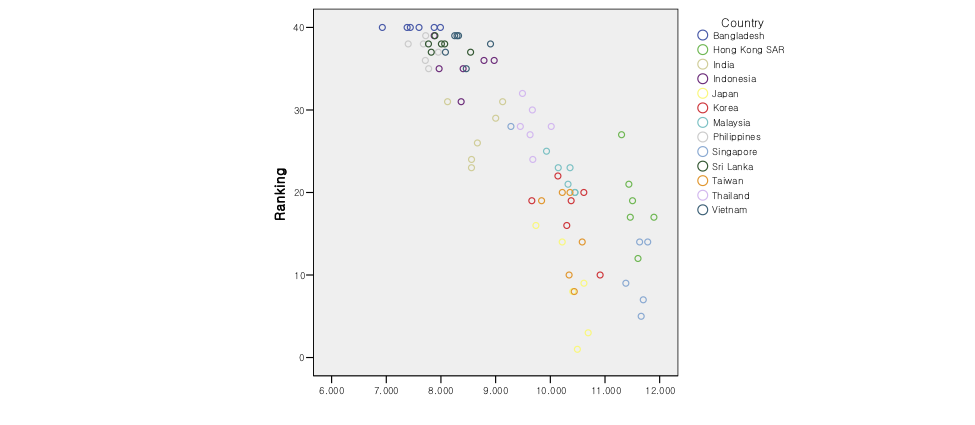
(X-axis:
Efficiency Enhancers (EE), Y-axis:ranking)
(X-axis:
Innovation and Sophistication Factors (IF), Y-axis:ranking)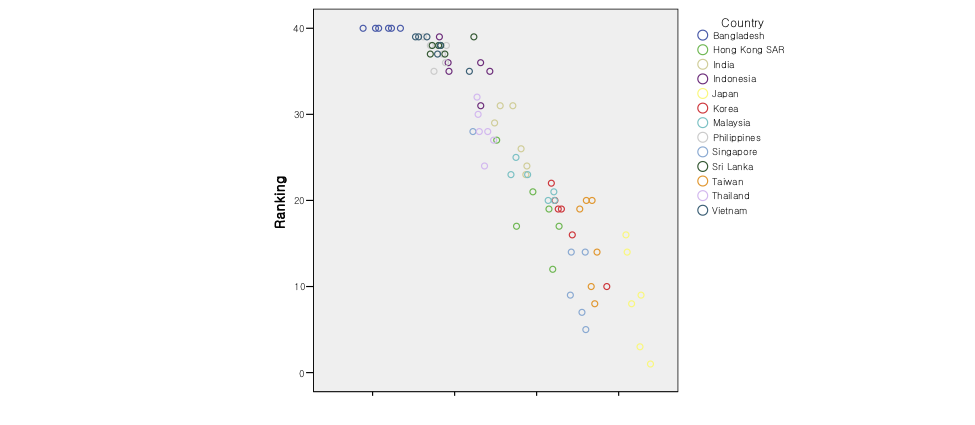
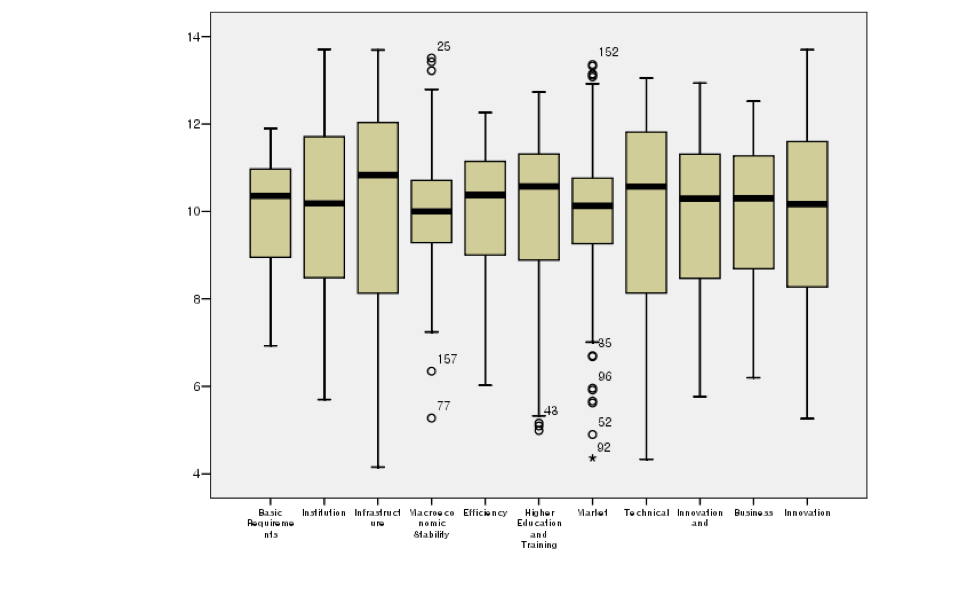
Boxplot: Data distribution
Infrastructure, Technical Readiness, Institutions, and Innovation have a large distribution of data.
Decision Tree
K-means clustering
- Advanced countries
Asia top 6 countries (Cluster K=2):Taiwan,HongKong,Japan,Korea,Singapore,Malaysia- Middle-level countries
Asia second-top 5 countries (Cluster K=3):Sri Lanka,India,Thailand,Vietnam,Indonesia- Lowest-level countries
Asia low-ranked 2 countries (Cluster K=1):Bangladesh,Philippines
I use K-means clustering to distinguish the data set and find the characteristics for each cluster. The size of K starts from 2 and clustering is repeated until the lift value is no longer increased. I choose the cluster K = 3 because the lift value is increased, and the corresponding precision and recall values are also reasonable.
- Metrics
Predicted yes | Predicted no | |
|---|---|---|
| True | a | b |
| False | c | d |
- precision = a/(a+c)
- recall = a/(a+b)
- lift = a/(a+c) / (a+b)/(a+b+c+d)
- cluster K = 2
| cluster # | instances # | Countries | lift | precision | recall |
|---|---|---|---|---|---|
| 1 | 43 | Bangladesh, India, Thailand, Vietnam, Philippines, Sri Lanka, Indonesia (7/13) | (42/43) / (42/78) = 1.81 | (42/43) * 100 = 97.6(%) | (42/42) * 100 = 100(%) |
| 2 | 35 | Japan, Korea, Malaysia, Singapore, Taiwan, HongKong (6/13) | (35/35) / (36/78) = 2.17 | (35/35) * 100 = 100(%) | (35/36) * 100 = 97.2(%) |
- cluster K = 3
| cluster # | instances # | Countries | lift | precision | recall |
|---|---|---|---|---|---|
| 1 | 15 | Bangladesh, Philippines (2/13) | (10/15) / (12/78) = 4.33 | (10/15) * 100 = 66.7(%) | (15/12) * 100 = 100(%) |
| 2 | 35 | Japan, Korea, Malaysia, Singapore, Taiwan, HongKong (6/13) | (35/35) / (36/78) = 2.17 | (35/35) * 100 = 100(%) | (35/36) * 100 = 97.2(%) |
| 3 | 28 | India, Thailand, Vietnam, Sri Lanka, Indonesia (5/13) | (25/28) / (30/78) = 2.32 | (25/28) * 100 = 89.2(%) | (28/30) * 100 = 93.3(%) |
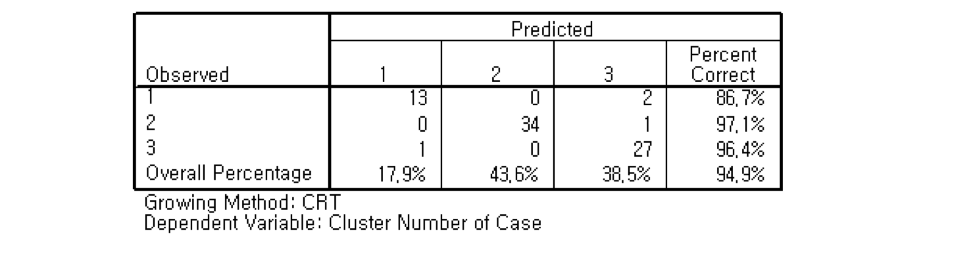
CRT (Classification and Regression Tree)
To become the advanced countries, the
Infrastructureis the most important factor.Innovation and Sophistication Factors (IF)determines the boundaries between the lowest-level and middle-level countries.
CRT tree based on the clusters of K = 1, 2, 3
Significance-level for splitting nodes: 0.05, merging: 0.05Minimum number of cases - parent node: 20, child node: 10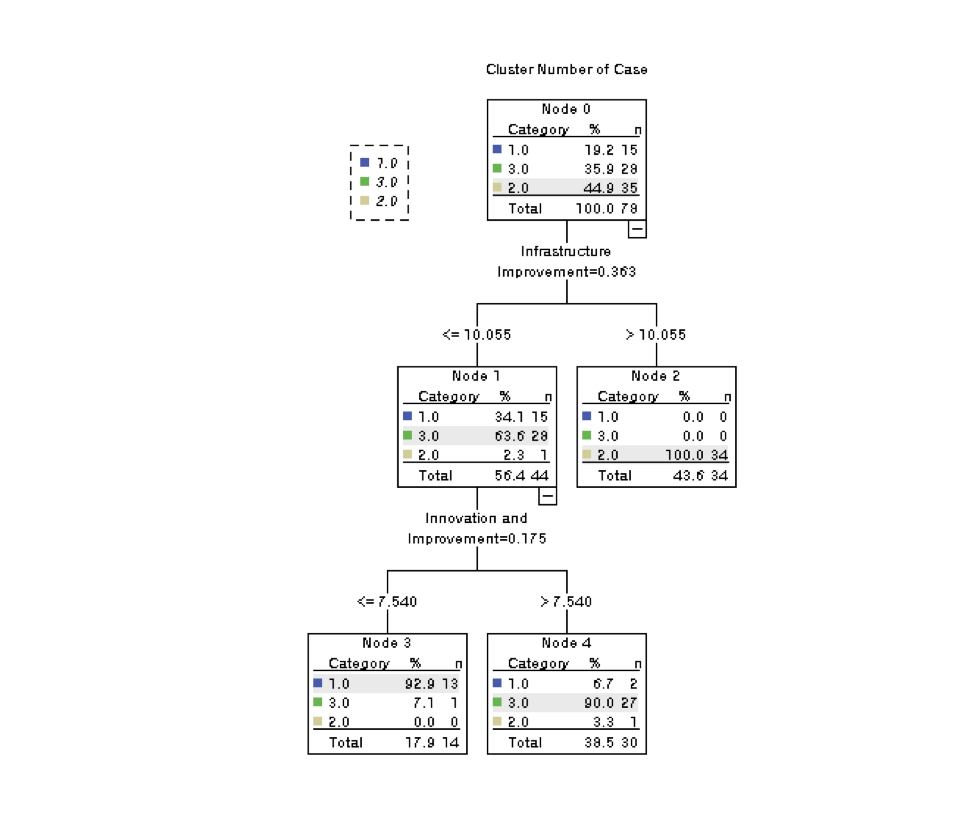
TheNode 2represents the Asia top 6 countries, so it can be said that the infrastructure is very critical to become the advanced countries. (Infrastructure> 10.055). The rest of the countries are allocated atNode 1in which theInnovation and Sophistication Factors (IF)determines the boundaries between the lowest-level and middle-level countries.Model summary
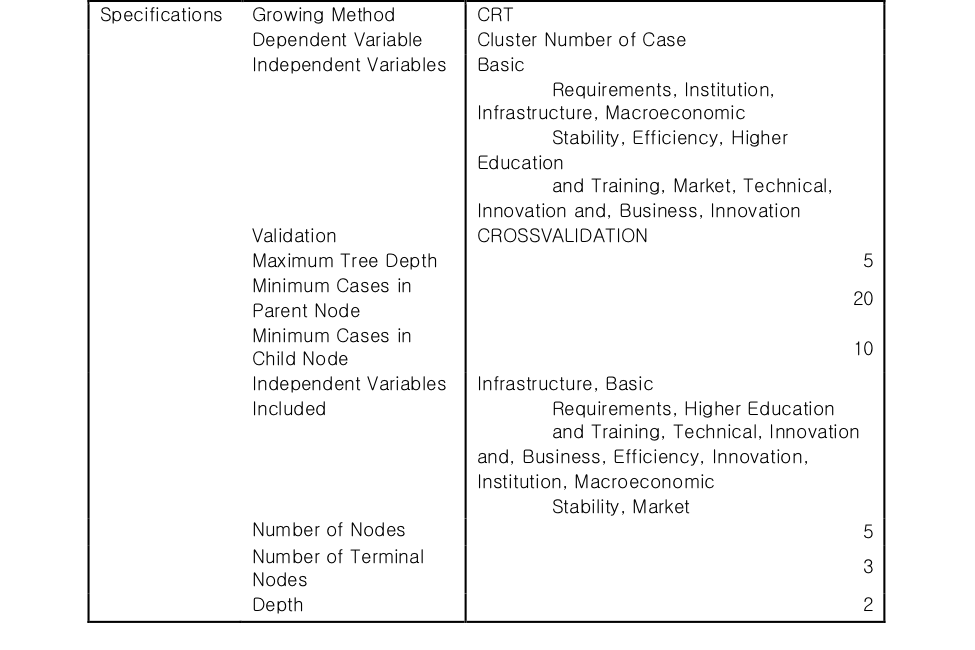
Validation (10-Fold Cross Validation)
Summary
From the data set of the Global Competitiveness Index (GCI), the key factors that determine the national competitiveness and productivity have been identified. I notice that the Infrastructure is the most important factor to become the advanced countries. Innovation and Sophistication Factors (IF) is another critical factor to determine the lowest-level and middle-level countries. From the result of the analysis, to become advanced countries, I suggest developing countries should strengthen the capabilities of infrastructure, business sophistication, and innovation.