
Improvement of change-proneness prediction
Period: March 2006 - February 2009
Table of Contents
- Motivation and Goal
- Method
- Experiment
3.1 Goal
3.2 Data sets
3.3 Evaluation method - Results
- Conclusion
- Papers
- Awards
Motivation and Goal
Software changed either to add new functionalities or to fix bugs. Some part of the software may be more prone to be changed than others. Finding software parts that are more likely to change can be useful because we can decide how to effectively invest the software maintenance efforts. In previous studies, most of the metrics used to build a change-proneness predictive model are based on the structural complexity of software programs.
To improve the accuracy of the change-proneness prediction, I propose the new behavioral dependency metric that captures the aspects of the dynamic behavior program.
Method
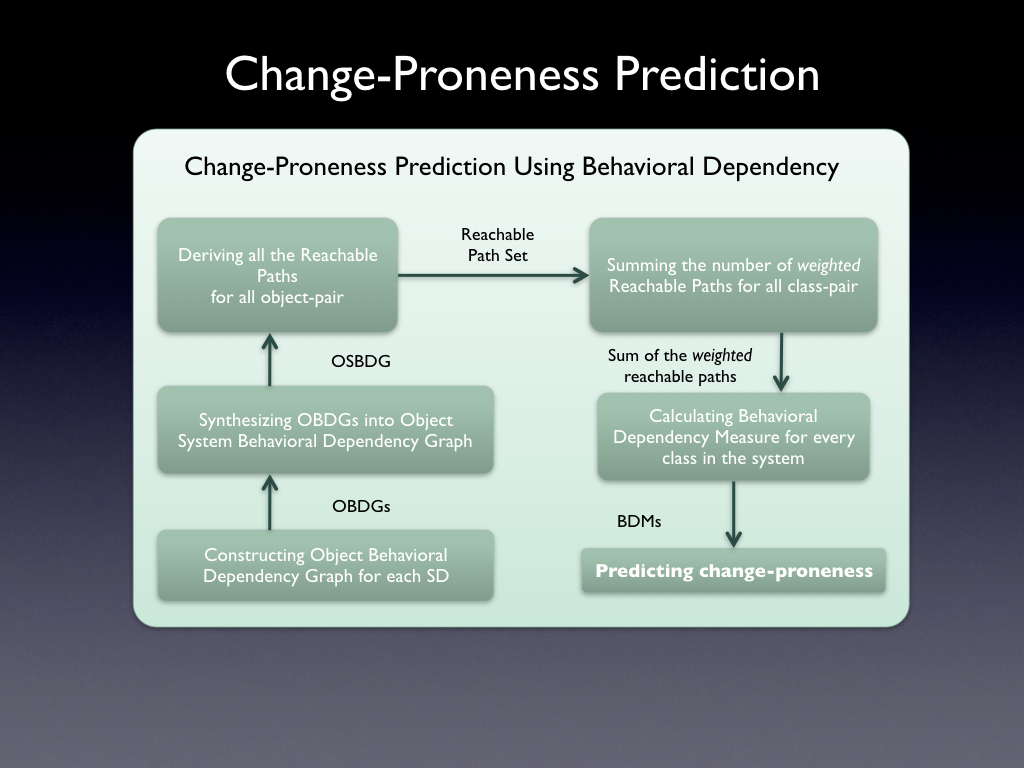
Overview of the change-proneness prediction
Illustrative example for calculating all reachable paths for all pairs of objects in the system
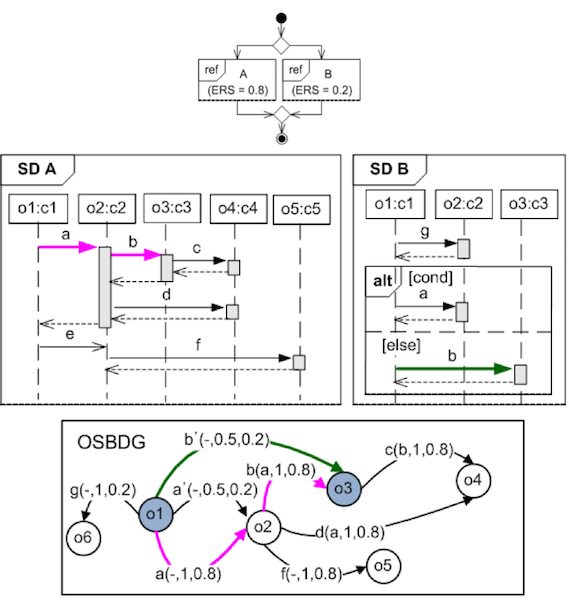
The key concept for measuring the behavior dependency metric is to measure the dependency by weighting the control flows (e.g., choice or loops) into messages exchanged between the two classes.
Experiment
Goal
To show that the behavioral dependency metric is the useful and additional explanatory variable for change-proneness prediction
Data sets
JFreeChart ver 1.0.0: Open-source Java class library for generating various types of charts
- Measured metrics: six C&K metrics
| Independent variables |
|---|
- NOC (number of children)- DIT (depth of inheritance tree) - WMC (weighted methods per class) - RFC (response for a class) - CBO (coupling between objects) - LCOM (lack of cohesion in methods) |
- Metric of change-proneness
| Dependent variables |
|---|
| Total amount of changes (source lines of coded added and deleted) across the six releases (ver 1.0.1 ~ ver 1.0.6) |
Evaluation method
Compare goodness of the fit (R2) of the multivariate regression models constructed with and without the behavioral dependency metric along with the two different independent variable sets
| Comparators | Description |
|---|---|
| Model with behavioral dependency metric in addition to C&K metrics (our approach) | - Dependent variables: metric of change-proneness - Independent variables: behavioral dependency metric + C&K metrics |
| Model with only C&K metrics | - Dependent variables: metric of change-proneness - Independent variables: C&K metrics |
| Evaluation measure |
|---|
| Goodness of the fit (R^2) |
Results
R2 is increased by 8% using the behavioral dependency metric.
Regression model with only C&K metrics:
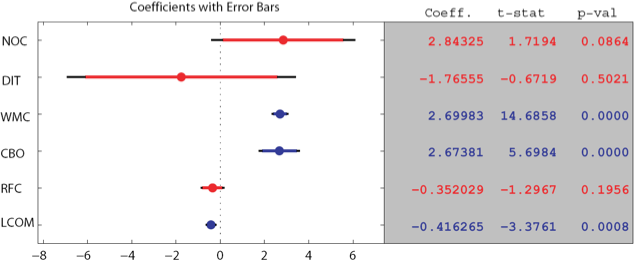
- Explains around 56% (adjusted R2 of 0.55)
- Selected variables: WMC (1st), CBO (2nd), and LCOM (3rd)
Regression model with the behavioral dependency metric in addition to C&K metrics:
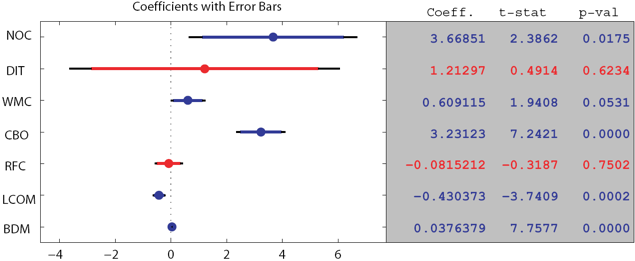
- Explains around 64% (adjusted R2 of 0.64)
- Selected variables: WMC (1st), BDM (behavioral dependency metric) (2nd), and CBO (3rd), LCOM (4th), and NOC (5th)
Conclusion
The behavioral dependency metric in conjunction with existing structural metrics help to make a more accurate prediction change-proneness model.
Papers
Measuring behavioral dependency for improving change-proneness prediction in UML-based design models
Ah-Rim Han, Sang-Uk Jeon, Doo-Hwan Bae, Jang-Eui Hong
Journal of Systems and Software (JSS), Vol. 83, No. 2, pp. 222-234, Feb. 2010
[PDF] [DOI]Behavioral Dependency Measurement for Change-proneness Prediction in UML 2.0 Design Models
Ah-Rim Han, Sang-Uk Jeon, Doo-Hwan Bae, Jang-Eui Hong
Proceedings of the 32nd Annual IEEE International Computer Software and Applications (COMPSAC), pp. 76-83, Jul. 2008
(19.5% acceptance ratio, 46/236)
[PDF] [DOI] [Slide]
Awards
The paper Behavioral Dependency Measurement for Change-proneness Prediction in UML 2.0 Design Models was invited for the publication to the Special Issue for Journal of Systems and Software. The top quality papers of the IEEE International Conference on Computer Software and Applications 2008 are selected by program committee.